Playoff Worthiness: who has earned a playoff spot
Our 12
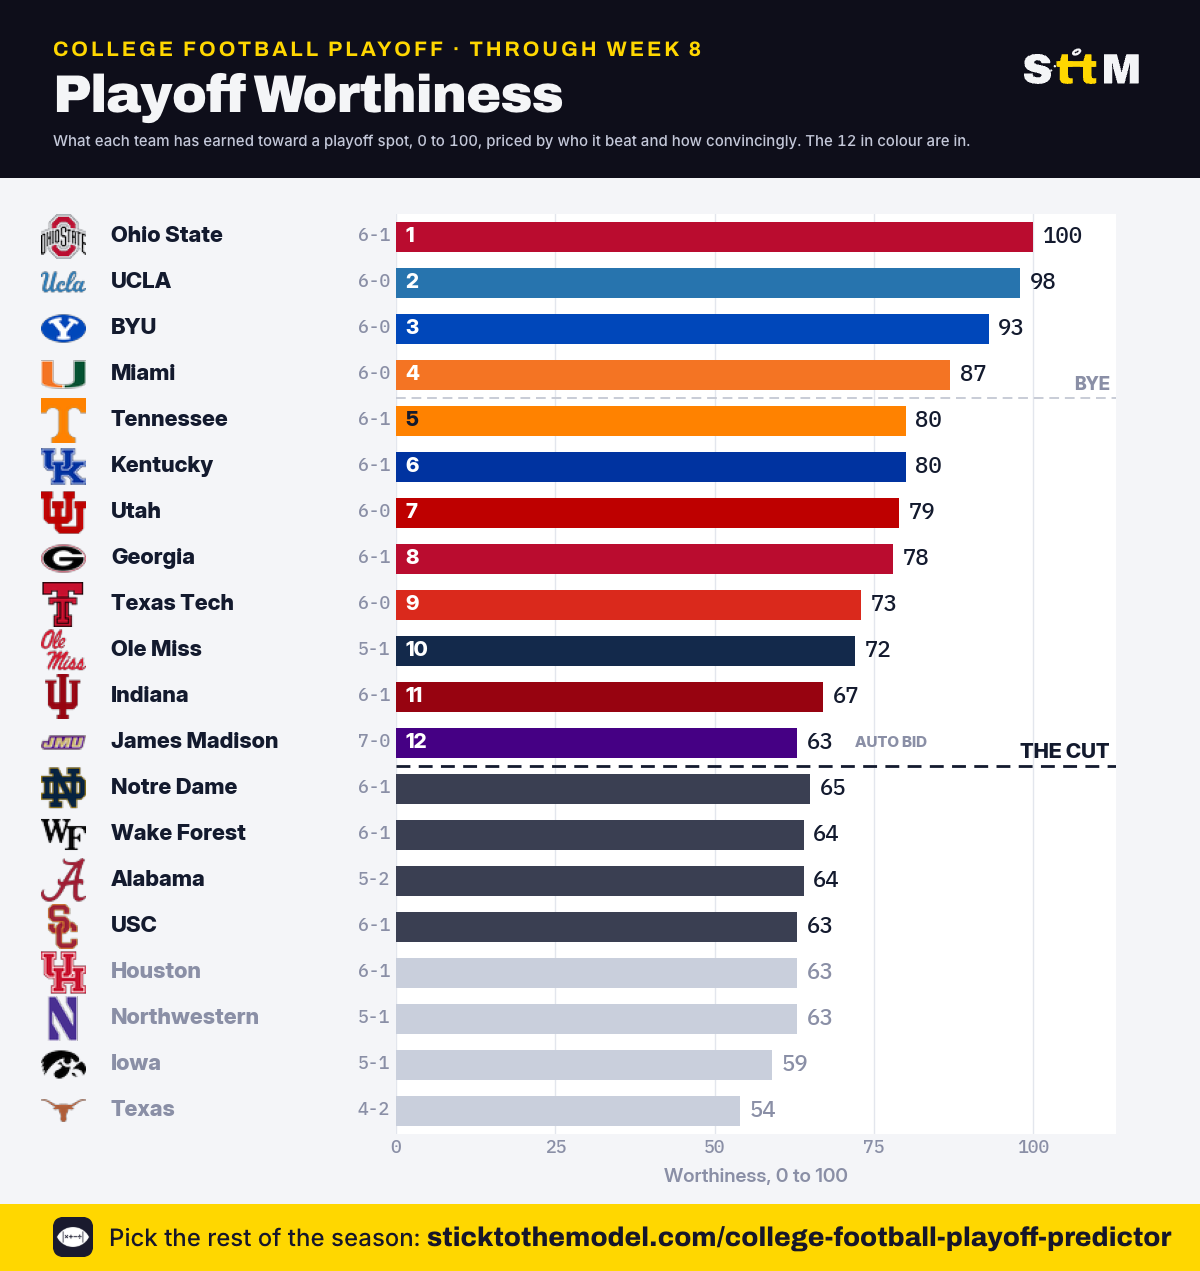
The field if it were picked on what teams have earned. Tap a team to run its path in the Playoff Machine.
 Ohio State1006-1 · earned +1.11Auto bid2
 UCLA986-0 · earned +1.073
 BYU936-0 · earned +0.96Auto bid4
 Miami876-0 · earned +0.83Auto bid5
 Tennessee806-1 · earned +0.67Auto bid6
 Kentucky806-1 · earned +0.667
 Utah796-0 · earned +0.648
 Georgia786-1 · earned +0.639
 Texas Tech736-0 · earned +0.5110
 Ole Miss725-1 · earned +0.4911
 Indiana676-1 · earned +0.3812
 James Madison637-0 · earned +0.29Auto bid
 Notre Dame 65
 Wake Forest 64
 Alabama 64
 USC 63
Every contender
One row per team still in it. Sort any column. SOS and team ranks are among all 136 FBS teams; the toughest schedule so far belongs to Texas, the softest in our 12 to James Madison.
| # | Team | Worthiness | Record | Earned wins | SOS | SOS left | Ceiling | Team rank | Best win | Worst loss | Make it | Status |
|---|---|---|---|---|---|---|---|---|---|---|---|---|
| 1 | Ohio State | 100 | 6-1 | +1.11 | 11 | 2 | +3.04 | 1 | Indiana | Texas | 89% | In |
| 2 | UCLA | 98 | 6-0 | +1.07 | 12 | 15 | +2.59 | 44 | Oregon | – | 35% | In |
| 3 | BYU | 93 | 6-0 | +0.96 | 38 | 50 | +2.53 | 22 | Notre Dame | – | 59% | In |
| 4 | Miami | 87 | 6-0 | +0.83 | 83 | 40 | +2.58 | 4 | Clemson | – | 98% | In |
| 5 | Tennessee | 80 | 6-1 | +0.67 | 25 | 35 | +2.40 | 17 | Alabama | Texas | 33% | In |
| 6 | Kentucky | 80 | 6-1 | +0.66 | 9 | 27 | +2.33 | 48 | Texas A&M | Alabama | 7% | In |
| 7 | Utah | 79 | 6-0 | +0.64 | 34 | 7 | +2.27 | 19 | Iowa State | – | 65% | In |
| 8 | Georgia | 78 | 6-1 | +0.63 | 29 | 31 | +2.36 | 5 | Alabama | Auburn | 86% | In |
| 9 | Texas Tech | 73 | 6-0 | +0.51 | 95 | 60 | +1.95 | 9 | Arizona State | – | 92% | In |
| 10 | Ole Miss | 72 | 5-1 | +0.49 | 7 | 10 | +2.64 | 12 | LSU | Florida | 28% | In |
| 11 | Indiana | 67 | 6-1 | +0.38 | 39 | 47 | +1.92 | 3 | Rutgers | Ohio State | 91% | In |
| 12 | Notre Dame | 65 | 6-1 | +0.33 | 35 | 9 | +1.64 | 2 | Wisconsin | BYU | 97% | Bubble |
| 13 | Wake Forest | 64 | 6-1 | +0.31 | 20 | 68 | +1.40 | 49 | NC State | Miami | 21% | Bubble |
| 14 | Alabama | 64 | 5-2 | +0.30 | 3 | 37 | +1.75 | 8 | Mississippi State | Tennessee | 40% | Bubble |
| 15 | USC | 63 | 6-1 | +0.29 | 10 | 3 | +2.36 | 11 | Penn State | Oregon | 41% | Bubble |
| 16 |  Houston | 63 | 6-1 | +0.29 | 47 | 69 | +1.55 | 28 | Kansas State | Texas Tech | 31% | Out |
| 17 | James Madison | 63 | 7-0 | +0.29 | 112 | 107 | +0.78 | 43 | Old Dominion | – | 100% | In |
| 18 |  Northwestern | 63 | 5-1 | +0.29 | 57 | 18 | +2.53 | 56 | Penn State | Indiana | 1% | Out |
| 19 |  Iowa | 59 | 5-1 | +0.21 | 36 | 64 | +1.61 | 24 | Washington | Ohio State | 26% | Out |
| 20 |  Texas | 54 | 4-2 | +0.08 | 2 | 5 | +2.31 | 6 | Ohio State | Florida | 30% | Out |
Every game, what it earned (the 12 plus the bubble)
Ohio State · earned +1.11UCLA · earned +1.07BYU · earned +0.96Miami · earned +0.83Tennessee · earned +0.67Kentucky · earned +0.66Utah · earned +0.64Georgia · earned +0.63Texas Tech · earned +0.51Ole Miss · earned +0.49Indiana · earned +0.38James Madison · earned +0.29Notre Dame · earned +0.33Wake Forest · earned +0.31Alabama · earned +0.30USC · earned +0.29This week’s chart
How good each contender is against what it has earned. Top right has done both.
Pick the rest of the season yourself →
How Playoff Worthiness works
What is Playoff Worthiness?
A score for what a team has earned toward a College Football Playoff spot, from results and how convincing they were. For every game, we ask how often a playoff-standard team (the 10th-best team in the betting market, +14.6 points on a neutral field) wins that game at that site, using the opponent's betting-market rating today. Then we credit the game by how the team competed: half for the result, half for the margin (a 14-point win is worth 0.9, a one-point win 0.54, a three-point loss 0.38; margins are capped at 24 so running up a score buys nothing). Credit minus expectation, added up over the season, is Earned Wins: wins above what a playoff team would have against the same schedule. The 0 to 100 score is that number scaled so this week's leader is 100 and a team that merely matched the standard is 50.
Why does an unbeaten team rank below a one-loss team?
Because of who they beat and by how much. A comfortable win over a team the market rates at zero earns about 0.1 of a win; a win over a top-five team earns more than half a win; a one-score escape against an FCS team costs. One-loss teams with two or three convincing big wins pass unbeaten teams that have not played anyone yet, and a close loss to the best team in the country costs almost nothing. The ceiling column shows what winning out would earn.
Where does the strength of schedule come from?
From the betting market. Every FBS game's closing point spread is solved for one rating per team, so the number for an opponent is what the market thinks of them right now, not a preseason guess or a poll. SOS is the average rating of the opponents played; SOS left is the average of the opponents remaining.
How is this different from the committee's rankings?
The committee ranks by eye and says it weighs record, strength of schedule, head-to-head and conference titles. Worthiness is the record and the schedule, priced, and nothing else. Across 70 committee rankings since 2014, our 12 matched the committee's 12 on 10.7 teams a week on average, against 8.9 for a plain record sort and 11.4 for the AP poll. 35 of the 48 final top-four teams were in our top four the week before. The gap is where the argument is.
How are the 12 picked?
The real rule: the five highest-ranked conference champions are in, seven at-large teams fill the field, and all twelve are seeded straight by rank, so the top four get byes and no bye is reserved for a champion. Before the conference title games, a conference's champion is its most worthy team. Champions come from every FBS conference, so a Group of 5 champion with a better resume than a power-conference champion takes the spot. Independents like Notre Dame can only get in at-large.
How often does it update?
Every Monday morning in season, after the weekend's games and the market's new prices, through selection Sunday.